Key Performance Indicators
The Group uses a large number of performance indicators to measure day to day operational and financial activity in the business. Most of these are studied on a daily, weekly or monthly basis. A well-developed management accounts pack, including profit and loss statements as well as key ratios related to capital productivity and customer satisfaction scores, are prepared for each profit centre monthly. In addition, every general manager in the business receives a weekly and monthly pack of indicators which is the basis of regular operational meetings.
There are five Key Performance Indicators (KPIs) which we use as measures of the longer-term health of the business and which we use to monitor progress in implementing the Group's strategic objectives. They are:
- Safety
- Earnings per share
- Return on average capital employed
- Customer loyalty
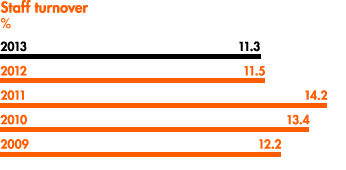
- Staff turnover
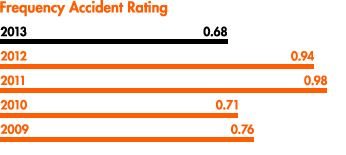
SAFETY
Our business involves the frequent movement of heavy equipment which, in its operation, produces lethal voltages and contains thousands of litres of fuel. Rigorous safety processes are absolutely essential if we are to avoid accidents which could cause injury to people and damage to property and reputation. Safety processes are also a basic benchmark of operational discipline and there is, in our view, a close correlation between a well-run business and a safe business.
The main KPI we use to measure safety performance is the internationally recognised Frequency Accident Rating ('FAR') which is calculated as the number of lost time accidents multiplied by 200,000 (being the base for 100 employees working 40 hours per week, 50 weeks per year) divided by the total hours worked. A lost time accident is a work related injury/illness that results in an employee's inability to work the day after the initial injury/illness.
The Group's FAR for 2013 was 0.68. This compares favourably to the benchmark of 1.9 reported for US rental and leasing industries published by the US Department of Labor in 2012, and is a noticeable improvement on the 0.94 FAR in 2012.
Further discussion of Health & Safety matters can be found in this report in the Principal Risks and Uncertainties section and Corporate Social Responsibility section.
FAR was as follows:
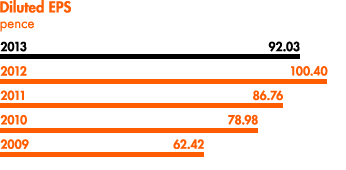
EARNINGS PER SHARE (EPS)
Measuring the creation or destruction of shareholder value is a complex and much-debated topic. We believe that EPS, while not perfect, is an accessible measure of the returns we are generating as a Group for our shareholders, and also has the merit of being auditable and well understood. So, for the Group as a whole, the key measure of short-term financial performance is diluted EPS, pre-exceptional items. EPS is calculated based on profit attributable to equity shareholders (adjusted to exclude exceptional items) divided by the diluted weighted average number of ordinary shares ranking for dividend during the relevant period (refer to Note 11 of the Annual Report). EPS for the year was 8% below the previous year. Trading performance for the year is described in the Trading Review.
Diluted EPS was as follows:
RETURN ON AVERAGE CAPITAL EMPLOYED (ROCE)
In a business as capital intensive as Aggreko's, profitability alone is a poor measure of performance: it is perfectly possible to be generating good margins, but poor value for shareholders, if assets (and in particular, fleet) are being allocated incorrectly. We believe that, by focusing on ROCE, we measure both margin performance and capital productivity, and we make sure that business unit managers are tending their balance sheets as well as their profit and loss accounts. We calculate ROCE by dividing operating profit for a period by the average of the net operating assets as at 1 January, 30 June and 31 December. The Definition and calculation of non GAAP measures section explains how the ROCE is calculated in more detail.
ROCE was as follows:
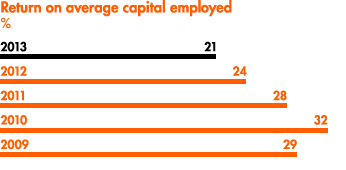
ROCE in 2013 was three percentage points lower than 2012 at 21%. This reduction was driven by the Power Projects business, mainly due to a lower level of diesel fleet utilisation and the anticipated reduction in Japan and Military revenues as these contracts finished, partly offset by a movement in the provision for bad debts. At 21%, ROCE is still at a high and, in our view, very attractive level. The importance of ROCE as a measure for Aggreko is illustrated by the fact that it is included along with earnings per share as the basis for the Company's Long-term Incentive Plan (details can be found in the Remuneration Report).
CUSTOMER LOYALTY
The Group deals every year with thousands of customers and we have developed a process by which we can objectively measure the performance of our business units, not only in financial terms but also the extent to which they are making customers feel inclined to return to us the next time they need the services we provide. We believe that near real-time measurement of our performance, as seen by our customers, gives us visibility of operational issues which might otherwise take months to emerge through the profit and loss account. Accordingly, we use the Satmetrix system whereby we send customers an email immediately after a contract closes asking them to fill out a detailed questionnaire about how they thought we performed. This data is then collated to conform to the same management structure as our profit and loss accounts so that, in monthly management accounts, we see not only a team's financial performance but also their operational performance as measured by how well their customers think they have done for the same period.
These questionnaires generate enormous amounts of data about how customers view our processes and performance and, in order to distil this down into a single usable indicator, we track a ratio called the Net Promoter Score (NPS). Broadly speaking, the NPS measures the proportion of our customers who think we do an excellent job against those who think we are average or worse. In 2013, approximately 22,000 questionnaires were sent out and we received around 4,500 replies: we believe that the scale of the response we get enables us to have confidence in this KPI.
Across the Group, our NPS over the last five years was:
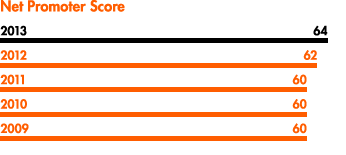
The increase in 2013 was driven by increases in our APAC and EMEA businesses partially offset by a decrease in the Americas business, albeit our Americas business scores the strongest of the three regions. Satmetrix, a global leader in customer experience programmes who manages over 21 million customer responses annually (including Aggreko's), has confirmed that our Net Promoter Score in 2013 was amongst the top quartile of all the companies benchmarked worldwide in the business-to-business segment.
STAFF TURNOVER
In a service business such as Aggreko, it is the attitude, skill and motivation of our staff which makes the difference between mediocre and excellent performance. Staff retention therefore is a reasonable proxy for how employees feel about our Company. We monitor staff turnover which is measured as the number of employees who left the Group (other than through redundancy) during the period as a proportion of the total average employees during the period. Staff turnover has decreased this year and is at its lowest over the past five years, analysed as follows:
As well as measuring staff turnover, the Group carries out a regular global opinion survey, conducted by an independent third party, in which every employee is invited to say what they think about Aggreko. The results from the last global opinion survey conducted in 2013 put Aggreko in the top quartile with peer group companies. Despite over 1,300 new people coming into the business in the period between the surveys, the feedback from 5,100 responses (86% return rate) was very positive and very much in line with the results compared to the previous survey. Aggreko continues to have a strong culture with highly committed people, demonstrated by:
- 88% found Aggreko an exciting place to work;
- 89% were proud to work for Aggreko; and
- 89% understood how the work they do contributes to the achievement of Aggreko's strategic goals and objectives.